How AI-Driven Dashboards Will Redefine Supply Chain Performance in 2026

How AI-Driven Dashboards Will Redefine Supply Chain Performance in 2026
AI-driven dashboards will close the visibility gap that keeps supply chain leaders in reactive mode, replacing delayed, fragmented reporting with real-time AI visibility and automated decision support across manufacturing, retail, and enterprise operations by 2026. The organizations that win will not be the ones with the most algorithms, but those that operationalize AI dashboards as the control layer over their data, workflows, and teams.
Why visibility is still broken
Most enterprises have invested in analytics, yet critical decisions still depend on stale reports and manual interpretation instead of live, AI-generated recommendations. Data lives in disconnected ERPs, WMS, TMS, MES, and planning tools, which means leaders see yesterday’s performance instead of what is unfolding across plants, DCs, and channels right now.
That visibility gap drives familiar pain: planners firefight disruptions, predictive models fail in production because data pipelines are fragile, and teams revert to spreadsheets when exceptions spike. Even where dashboards exist, they often present static KPIs, not operational intelligence that explains why a deviation is occurring and what to do about it next.
From static BI to AI dashboards
Traditional BI dashboards describe what happened; AI dashboards continuously learn from streaming data and recommend what should happen next. They fuse historical trends, real-time signals, and probabilistic forecasts into a single surface where anomalies are detected, root causes are inferred, and actions are prioritized for planners and autonomous workflows.
By 2026, this shift will be standard across advanced supply chains, with AI-driven dashboards acting as the decision cockpit for both strategic and intra-day operations. This is not about more charts, but about embedding machine learning, optimization, and agent-based intelligence into the way leaders monitor and steer their networks.
What AI dashboards actually do
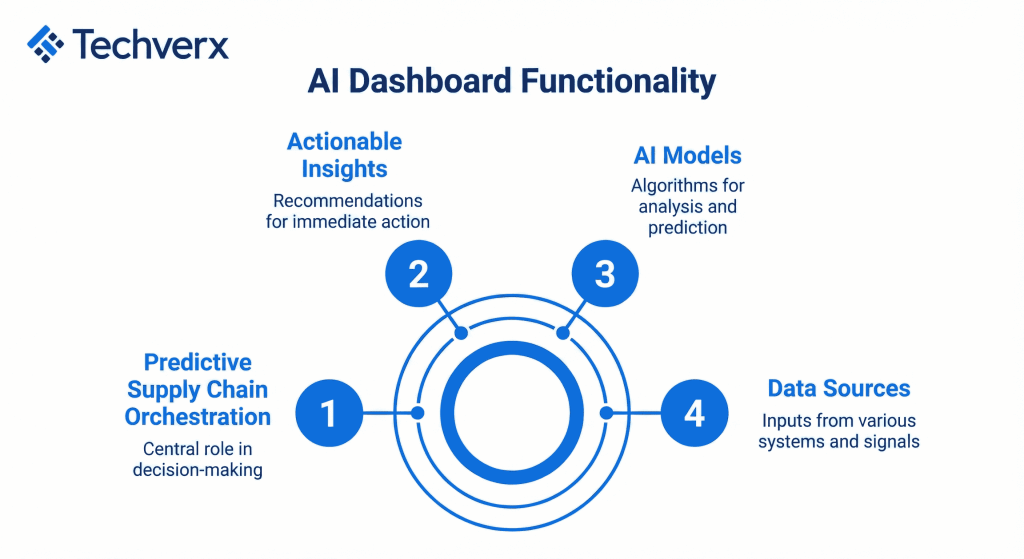
AI dashboards take in structured and unstructured data from ERPs, sensors, logistics platforms, e-commerce channels, partner APIs, and external signals like weather or macro indices. They apply models for demand forecasting, inventory optimization, capacity planning, risk scoring, and real-time anomaly detection, then surface ranked recommendations and predicted outcomes, not just raw metrics.
Instead of waiting for a weekly SOP review, planners get continuous, scenario-based views: projected stockouts, margin-impacting mix shifts, supplier slippage risk, or carrier performance degradation, each tied to suggested actions.
In effect, AI dashboards become the operating layer for predictive supply chain orchestration, coordinating decisions across planning, procurement, production, and logistics in near real time.
Live AI visibility where it actually matters
Manufacturers can use real-time AI visibility to connect sensor data from lines, inventory status, and order priorities, detecting throughput anomalies before they hit service levels. Recent academic work on AI in manufacturing supply chains shows that organizations implementing AI-driven forecasting systems have achieved more than a 30% improvement in demand forecasting accuracy and close to a 30% reduction in inventory carrying costs, with significantly fewer stockouts and disruptions
Retailers can unify store, e-commerce, and marketplace feeds, letting AI dashboards expose micro-region demand shifts early enough to rebalance inventory and reduce markdowns. Studies of AI-enhanced retail forecasting report double-digit improvements in perfect order rates and stockout reductions when machine learning models are embedded into day-to-day planning.
Logistics-intensive enterprises can integrate telematics, carrier APIs, and route performance to identify systemic delays and automatically suggest routing or consolidation changes per lane. Field evidence from AI logistics programs has shown improvements such as 20–25% faster delivery times and notable gains in fulfillment accuracy when AI is applied to routing and warehouse decisioning.
From reactive to predictive orchestration
Studies highlight that AI can reduce forecast error by 20–50% and materially lower lost sales when embedded into operational workflows, not just analytics tooling. McKinsey’s analysis of AI-based forecasting in supply chain environments, for example, finds that AI models can cut forecast errors by between 20% and 50%, reduce product unavailability and lost sales by up to 65%, and lower warehousing and administrative costs by mid–double-digit percentages
When those models live inside dashboards that trigger alerts, simulate impacts, and push decisions into execution systems, the organization moves from reacting to yesterday’s misses to orchestrating future outcomes. Predictive supply chain orchestration means the system continuously evaluates scenarios such as “promote alternate suppliers,” “re-route inbound freight,” or “adjust promotion intensity,” and scores them on margin, service, and risk.
Instead of leadership debating opaque reports, they see side-by-side simulations with confidence ranges, then accept, override, or fully automate classes of decisions.
Why data pipelines break AI promises
Many enterprises already run demand forecasting models or optimization engines, yet impact stalls because data pipelines are brittle and fragmented. Models are trained on clean historical sets, but production reality includes late files, inconsistent taxonomies, missing sensor feeds, and asynchronous updates across ERPs and planning tools.
This is why predictive models fail: they are not operationalized within a unified, governed data layer that handles quality, latency, and lineage end to end. AI dashboards expose these weaknesses, because their usefulness depends on a data foundation where events, master data, and decisions are all traceable and synchronized.
Operational intelligence, not more KPIs
Operational intelligence goes beyond descriptive metrics to answer three questions in one view: what is happening, why it is happening, and what should be done next. AI dashboards deliver this by combining anomaly detection, causal attribution, and prescriptive recommendations directly in the interface used by planners and line-of-business leaders.
For example, instead of just flagging that fill rates are dropping, an AI dashboard might explain that a specific forecast drift, supplier delay pattern, and promotion overlap are driving the deviation, then propose a ranked set of corrective moves. This reduces the dependency on manual interpretation and meeting-heavy root-cause analysis that currently slows decisions.
Close Your Supply Chain Visibility Gap
AI-driven dashboards help you detect issues early, act faster, and optimize operations with confidence. If you’re ready to move beyond static reporting, we’re here to help.
Mid-market and custom builds: the under-served segment
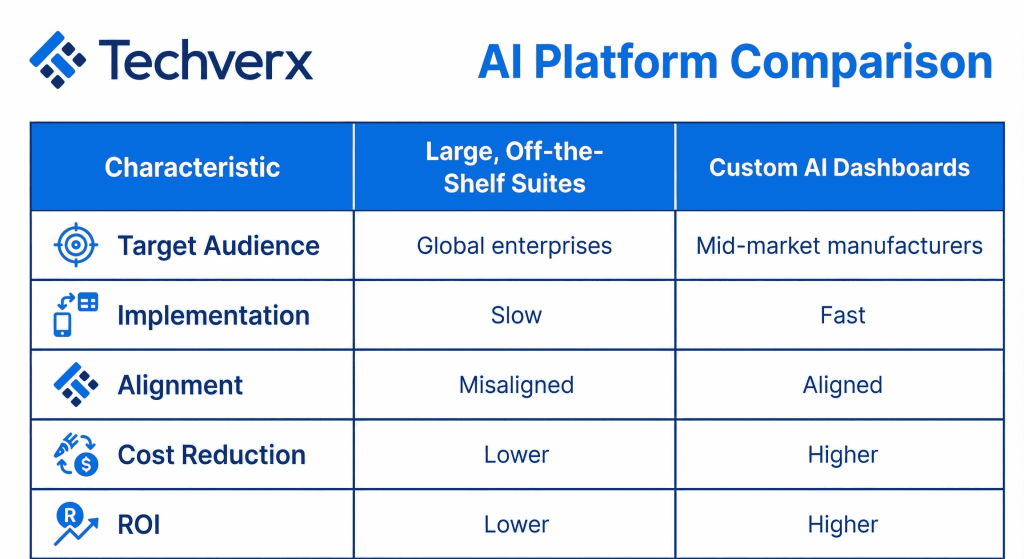
Most narratives around AI supply chain platforms focus on large, off-the-shelf suites targeting global enterprises with multi-year transformation budgets. Mid-market manufacturers, regional retailers, and operations teams with heterogeneous tech stacks often find those platforms over-scoped, slow to implement, and misaligned with their unique workflows and data realities.
Yet research shows that organizations adopting unified AI platforms, tailored to their context, can see multiple times higher adoption and ROI than teams relying on point tools. Industry research on predictive analytics in supply chains notes that even mid-market organizations are now achieving 20–50% forecast accuracy gains and 15–25% cost reductions with focused, right-sized deployments.
This is where custom AI dashboards, built around existing ERPs and operational systems rather than replacing them, unlock disproportionate value.
Sector-specific benefits by 2026
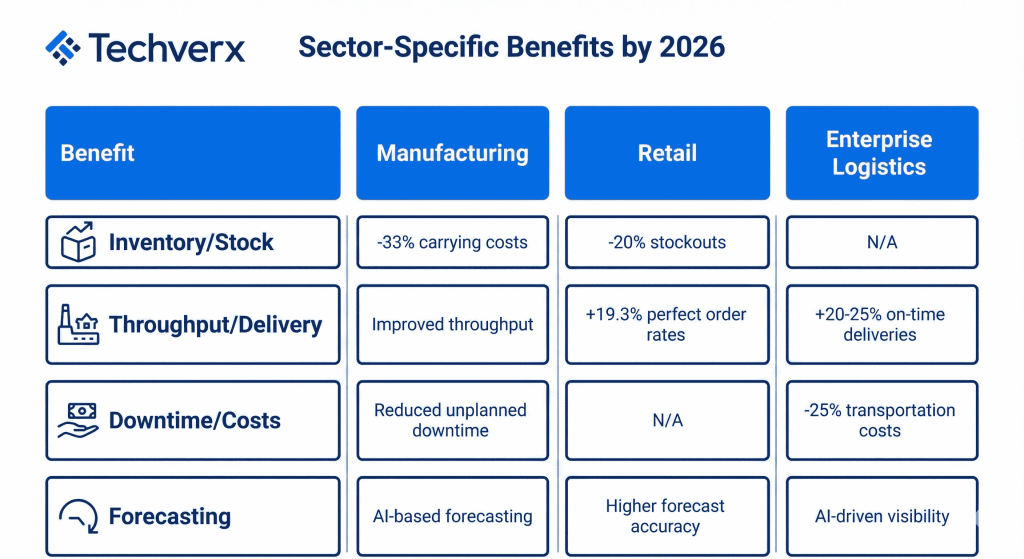
By 2026, AI dashboards will become a competitive baseline across core supply chain verticals, with sector-specific gains.
- Manufacturing: Plants using AI-driven dashboards for production sequencing, material availability, and predictive maintenance can cut inventory carrying costs by more than a third while improving throughput and reducing unplanned downtime. Recent quantitative work points to inventory carrying cost reductions in the 20–30% range and sizable drops in stockouts where AI-based forecasting is operationalized across manufacturing networks
- Retail: Retailers applying AI dashboards to unify store, DC, and online demand signals already demonstrate materially higher forecast accuracy and lower stockouts. Studies of AI in retail forecasting show improvements such as a 19.3% uplift in perfect order rates and more than 20% reductions in stockouts for chains that embed AI into planning.
Enterprise logistics and operations: AI-powered control towers combining live tracking, carrier performance, and risk signals have driven double-digit improvements in on-time performance and operating cost reductions in recent implementations. Broader surveys of AI in supply chain operations report that AI-driven visibility and routing optimization can improve on-time deliveries by 20–25% and cut transportation costs by up to 25%.
Why dashboards must augment ERP, not replace it
Core ERPs are not going away; they remain the system of record for orders, financials, and master data. AI-powered ERP augmentation via custom dashboards allows organizations to preserve these investments while layering advanced analytics, automation, and real-time orchestration on top.
Instead of fragmenting workflows across multiple vendor portals, an AI dashboard can consume ERP, WMS, and TMS data, enriching it with AI models and external signals, then push resulting decisions back into those systems via APIs.
This pattern lowers change-management friction and accelerates time-to-value because teams continue working in familiar tools while benefiting from a smarter, unified decision layer.
How Techverx approaches custom AI dashboards
Techverx focuses on building custom AI dashboards that unify disparate systems, expose real-time AI visibility, and embed operational intelligence into day-to-day execution for mid-market and enterprise supply chain teams.
Rather than forcing clients into rigid products, the emphasis is on tailored architectures that reflect each organization’s data maturity, process design, and integration landscape.
Typical engagements span discovery of critical decision moments, mapping of existing data sources and gaps, and design of AI dashboards that align with how planners, engineers, and operations leaders actually work. This ensures that capabilities like real-time anomaly detection, demand forecasting models, and AI-powered ERP augmentation show up where they drive adoption: in the dashboards stakeholders use every day.
Making 2026 the tipping point
Global research converges on a clear pattern: AI in supply chains delivers outsized returns when supported by unified data, real-time analytics, and decision-centric design. Companies already report large improvements in forecast accuracy, decision speed, and operational efficiency once AI is embedded into planning and execution platforms, not left as isolated pilots.
McKinsey’s work on AI forecasting, among others, shows that organizations implementing AI-based forecasting can reduce errors by 20–50%, cut stockout-related lost sales by up to 65%, and drive meaningful cost reductions across warehousing and administration.
Organizations that move now to operationalize these dashboards as their supply chain performance cockpit will set the bar for resilience, responsiveness, and ROI in the decade ahead.
What is the “visibility gap” in modern supply chains?
The visibility gap is the disconnect between how quickly disruptions occur and how slowly leaders see and respond to them, often because data is fragmented across ERPs, WMS, TMS, and planning tools and only surfaces in delayed, static reports. This forces teams into reactive decision-making, relying on manual interpretation of dashboards instead of real-time, AI-generated recommendations.
How are AI dashboards different from traditional BI dashboards?
Traditional BI dashboards largely describe what happened using historical data and fixed KPIs, while AI dashboards analyze streaming data to detect anomalies, forecast outcomes, and recommend actions in near real time. They embed machine learning and optimization directly into the interface, so planners see ranked options and predicted impacts rather than just charts and tables.
What measurable improvements can AI-driven dashboards deliver?
Research on AI in supply chain forecasting shows that AI can reduce forecast error by 20–50%, cut stockout-related lost sales by up to 65%, and lower warehousing and administrative costs by double-digit percentages when embedded into operations. Other studies report 20–30% reductions in inventory levels and 20–30% faster delivery times when AI is applied to inventory optimization and logistics decisioning.
Are AI dashboards only relevant for large enterprises?
No, mid-market manufacturers, regional retailers, and logistics providers often see faster ROI because AI dashboards can be tailored around their existing ERPs and operational systems instead of replacing them with monolithic suites. Custom, right-sized dashboards help these organizations unify data, automate high-impact decisions, and close the visibility gap without multi-year platform rollouts.
How does Techverx help organizations implement AI-driven supply chain dashboards?
Techverx focuses on building custom AI dashboards that sit on top of an integrated “insight layer,” connecting ERP and operational data to real-time AI models for forecasting, anomaly detection, and decision support. This approach lets supply chain and operations leaders move from reactive reporting to continuous, predictive intelligence without disrupting their core systems of record.

Amanda Hill
Amanda Hill is a Technology Implementation Specialist at Techverx, where she combines her expertise in data analysis, digital transformation, and project management to bring complex ideas to life. Passionate about innovation and operational efficiency, she helps clients seamlessly execute technology solutions that drive measurable impact.
Hiring engineers?
Reduce hiring costs by up to 70% and shorten your recruitment cycle from 40–50 days with Techverx’s team augmentation services.
Related blogs